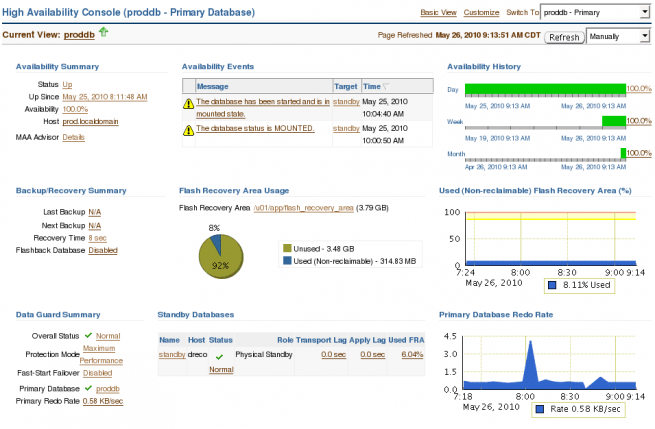
The High Availability Console provides the administrator comprehensive information about the primary and standby databases in a dashboard format. On one page you can see information about availability events, redo rates, transport and apply lag along with backup and recovery status and Fast Recovery Area Usage.
From the Database page for the Primary database click the Availability link.
On the Availability tab for the primary database click the High Availability Console link.
The High Availability Console is split into three sections: Availability, Backup/Recovery and Data Guard
The top section of the High Availability Console contains controls that allow you change and customize the information that is displayed.

Item 1 shows that we are in the High Availability Console looking at a Data Guard configuration.
The Current View (Item 2) lets you know instance that relates to the summary information displayed. Clicking the link presented in the Current View will take you to the instance home page.
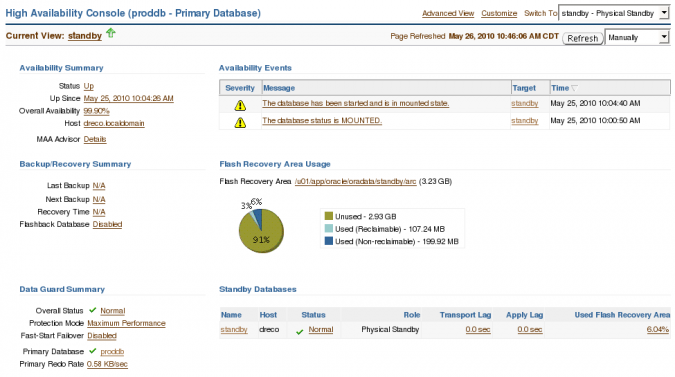
You can change the view type between Advanced and Basic View (Item 3). By default the Advanced View is displayed. The screen shot presented earlier displayed the Advanced View. Below is a screen shot of the Basic View.
The Advanced View adds a chart to each of the three sections. An Availability History chart is added to the Availability Summary. A chart detailing the used non reclaimable percentage of the Fast Recovery Area is added the Backup/Recovery Summary. A chart of the redo rate for the primary database is added to the Data Guard Summary.
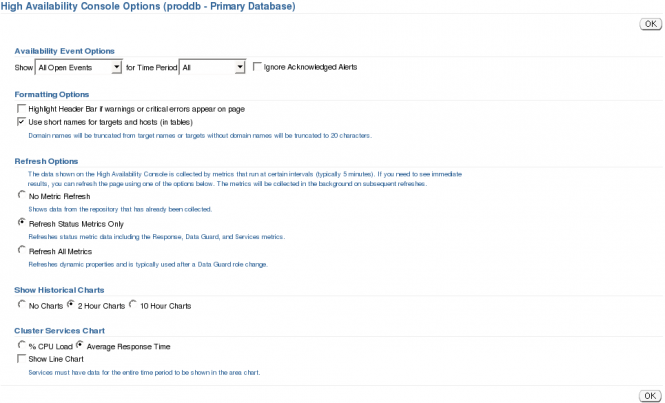
Using the Customize link (Item 4) you can configure various aspects of the console such as limit what is shown in the Availability Event, control the refresh options, time frame on historical charts and choose between%CPU Load and Average Response Time on the Cluster Services chart.
Using the Switch To drop down (Item 5) you can change Current View between the primary and standby instances. If you are currently using the Advanced View type the redo rate chart will change to chart detailing apply lag.
You can refresh statistics shown on the console manually by clicking the Refresh button or you can change the refresh from manual to automated (every 60 seconds or 5 minutes) using the drop down. Unless configured otherwise, the default refresh is Manually.
Availability Section
The Availability Section is split into three parts: Summary, Events, and History
The Summary section contains links that will allow you to drill own into the history status (Status, Up Since, Availability), view the host’s home page (Host) or view recommendations from the Maximum Availability Advisor.
The Events section contains links that will take you to Alerts tab with search criteria for standby pre-populated.
The history section contains links that will take you to the same history status page detailed in the Summary section only specific to the Day, Week and Month.
Backup/Recovery Section
The Backup/Recovery Section is split into three parts: Summary, Fast (Flash) Recovery Area Usage and Used (Non-reclaimable) Fast Recovery Area%.
The Summary section contains links to the Schedule Backup page (Last Backup, Next Backup) and the Recovery Settings Page (Recovery Time, Flashback Database.)
The Fast (Flash) Recovery Area Usage section provides links to Recovery Settings page (Flash Recovery Area) and detailed information on Fast (Flash) Recovery Area(the pie chart.)
The Used (Non-reclaimable) Fast Recovery Area% chart is a link to a customizable chart detailing the Non-reclaimable usage.
Data Guard Section
The Data Guard Section, like the previous sections, is split into three parts: Summary, Standby Databases, Primary Database Redo Rate Chart.
The Summary section contains links to the Data Guard control page (Overall Status, Protection Mode, Fast-Start Failover), the home page for the primary database and a customizable chart detailing the redo generation rate.
The Standby Databases section contains links to the standby instance home page (name), the Data Guard control page (status) and drill down links to transport lag, apply lag and Fast Recovery Area usage by the standby.
The Primary Database Redo Rate chart is a link to a customizable chart detailing the redo generation rate.
Whether you need a quick status update or central point monitor or manage your Data Guard environment the High Availability Console is a great tool to have at your disposal.


